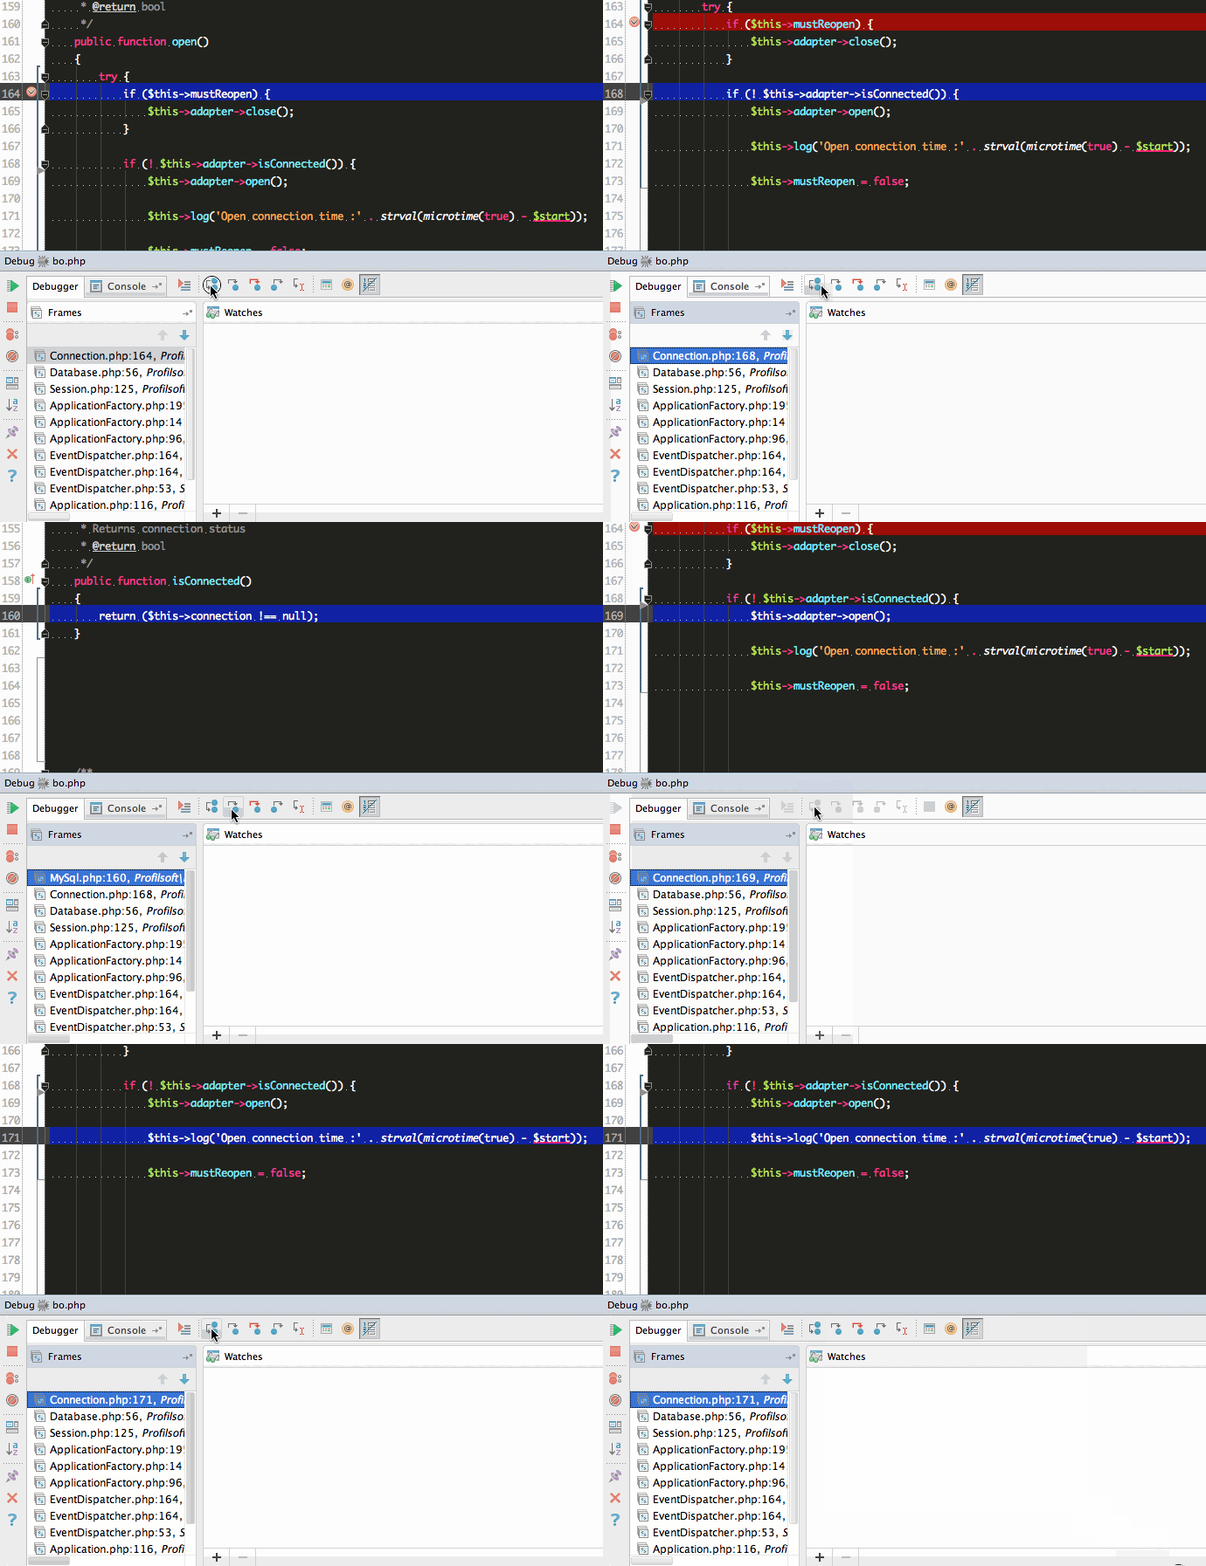
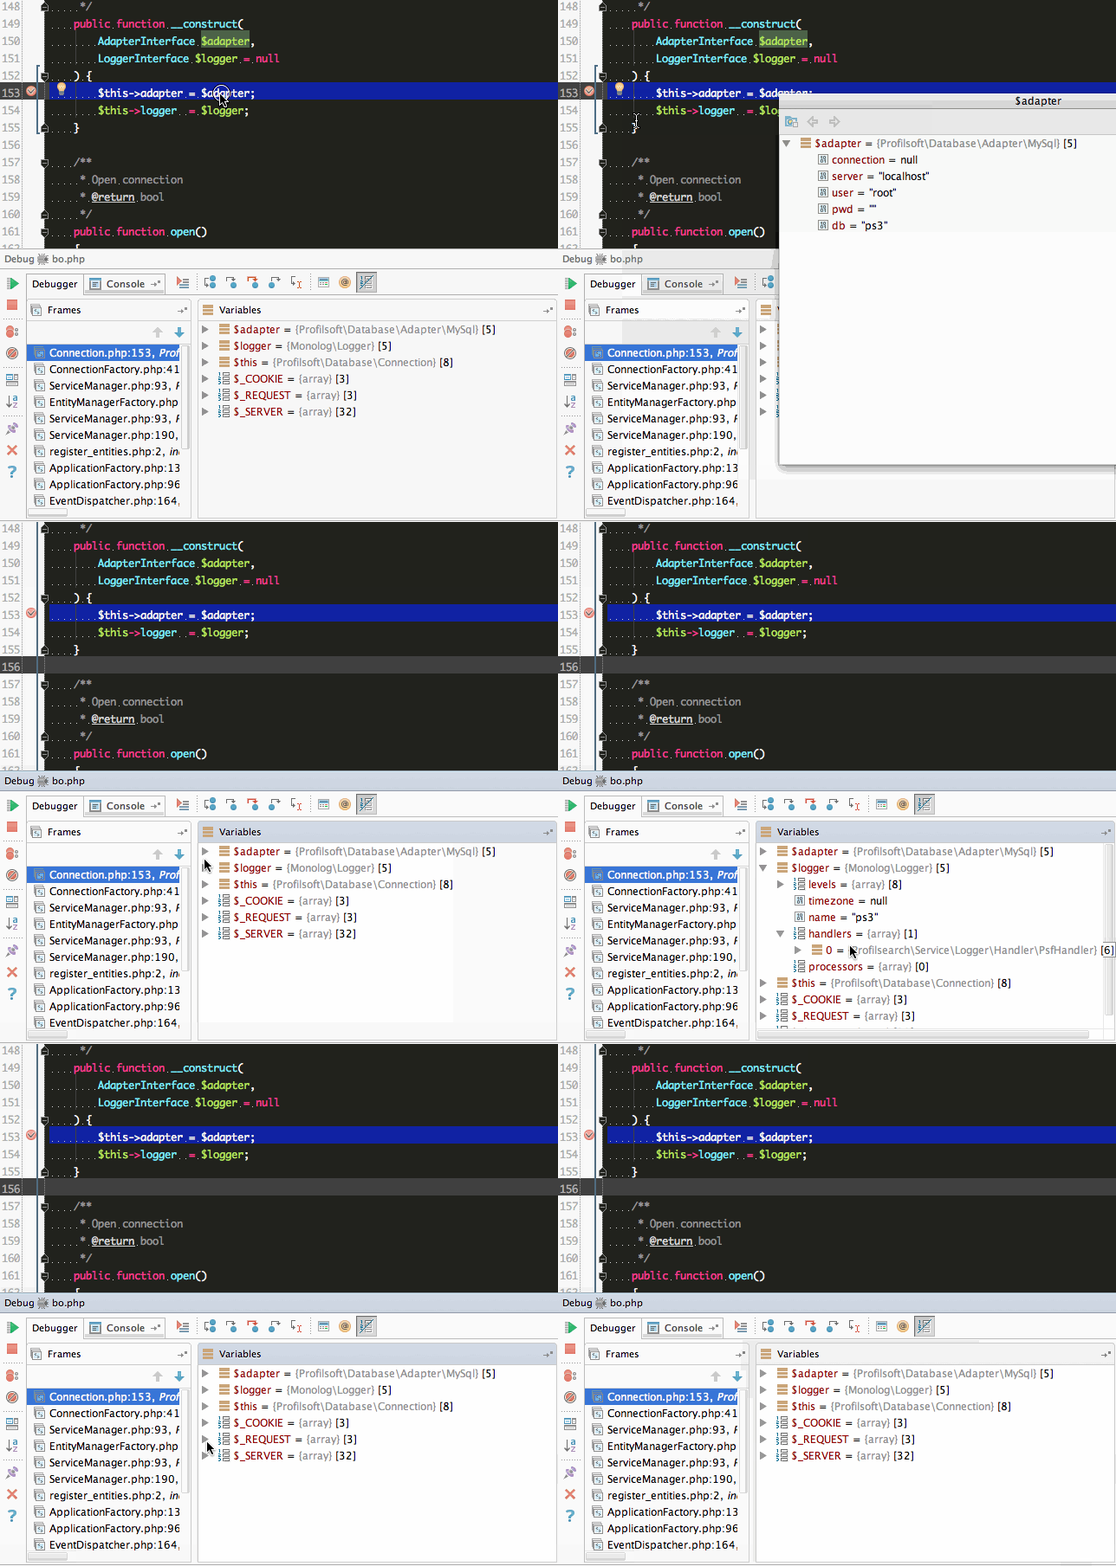
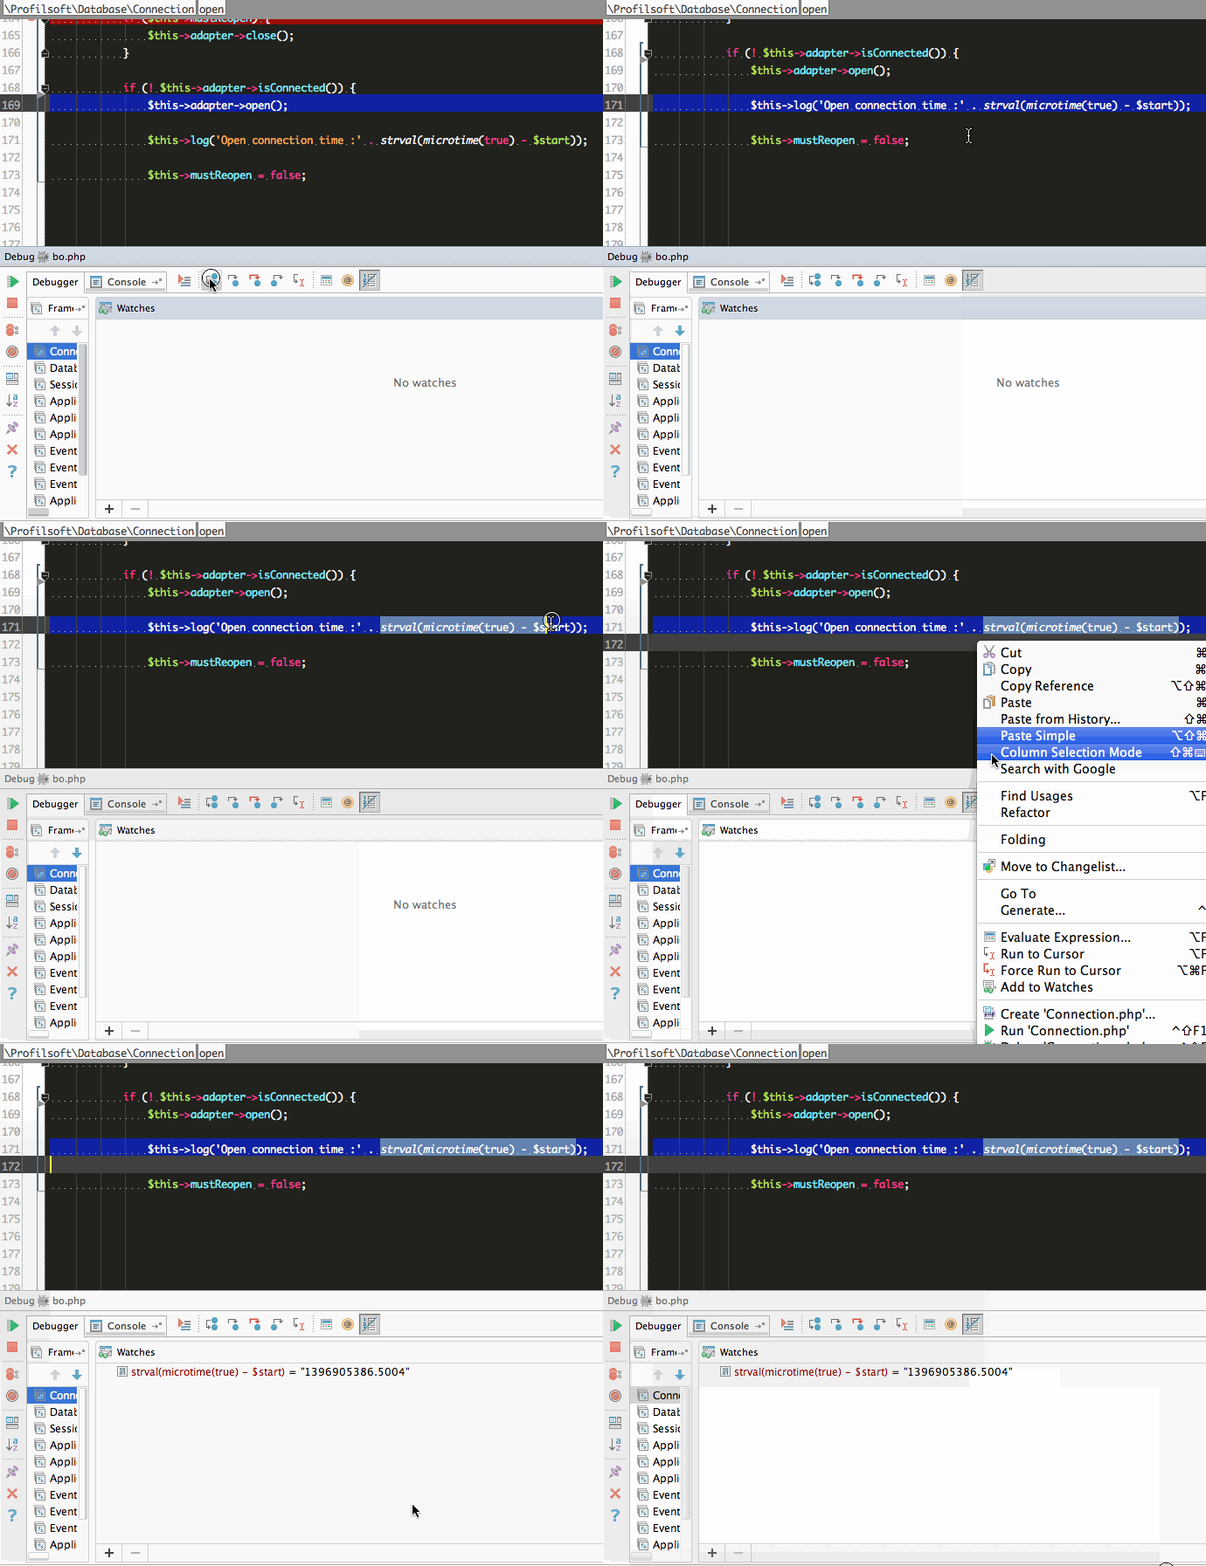
What’s single-stepping?

Single-stepping (or step-by-step debugging) is a way to control the execution flow of a program, while being able to evaluate arbitrary code during so. It means that you can actually see your program running, and walk through it, while being able to examinate every variable, manually run any method, like an omniscient divinity.
This gives you an invaluable help when trying to wrap your head around a particular bug, or to understand what a convoluted piece of code is actually doing.
Difference with the beloved var_dump()
Not intrusive
The major difference is that debugging is not intrusive: you don’t have modify your code to be able to get informations.
Let me say it again: without modifying your code.
- Ever commited a
var_dump($foo); die;and brokethe productionthe build? - Ever updated a file on a server, then found you broke the live application because of a misspelled method? Or because the file now belongs to
admin:admininstead ofapache:http? - Ever scanned through a file to remove all your
echo("I'm here");?
A Better UX
A (cliché) common debug-loop using var_dump():
- Insert
var_dump($foo); - Refresh the page
- Searching for the output…
- Hum, I should have put a
<pre>on it. Scanning through it. - Hum, I see…
var_dump()is not on the right place. Where is the next called method defined? - I’d better not forget to remove this
var_dump()when I’m done - Whoops, parse error.
- What was I looking for?
What you can get
- Clic to setup a breakpoint in your favorite IDE
- Refresh the page
- Your IDE popup
- Follow the execution flow. Decide if you enter a method or just go to the next line of code
- Examinate any variable state or method returned value
- Hunt and kill that bug

How?
The main debugger in the PHP world the Xdebug. It has been there for more than 10 years now — since 2003 — and extra-good care is taken of it by the tremendous Derick Rethans, among other great pieces of work, like the MongoDB PHP driver.
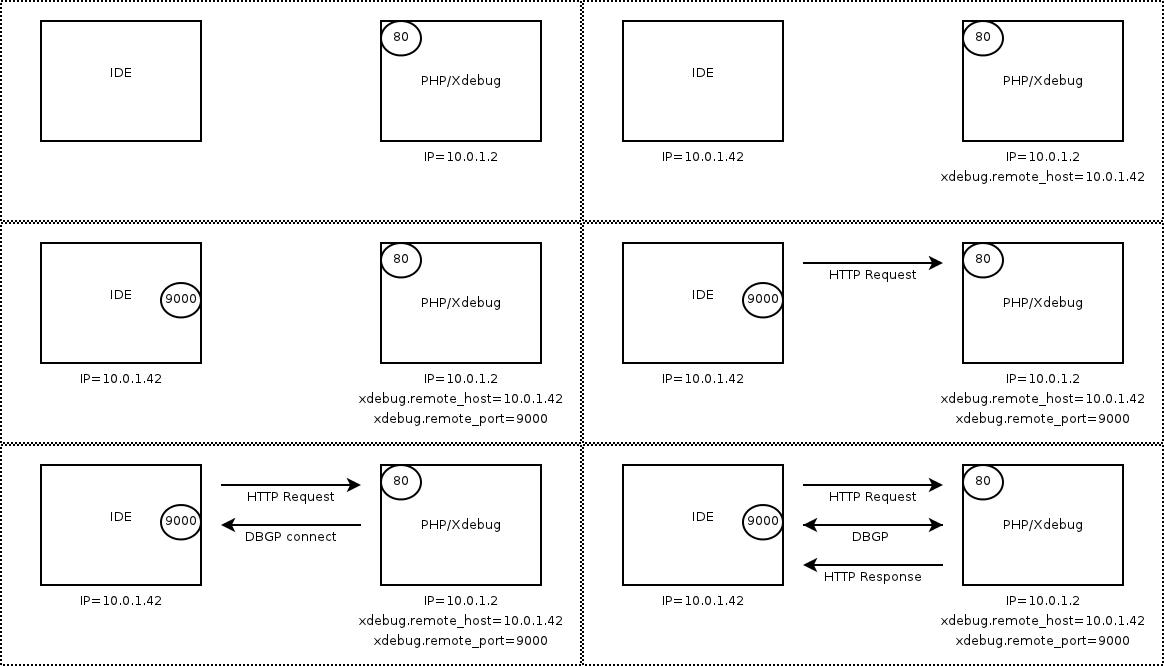
Unlike usual debugging, as with a C-written program, the execution of PHP usually happens in a remote machine. As such, it’s not the developer machine that controls the execution flow of the directly, but rather the server that connects to the developer machine, to signal that the program is executing and asking when to stop and when to run.

Notice how the server initiate the full-duplex connection, that will serve to enable dialog between the IDE and PHP.
Configuring your environment
Checklist first:
- Use an IDE that handles debugging: PHPStorm, Sublime Text, Netbeans (yes, Netbeans), or even Vim or Emacs. A more exhaustive list can be found on the Xdebug website
- Have Xdebug installed on your PHP.
Note: I do not recommend compiling it by yourself, unless you have some time before you.
Quick check to ensure Xdebug is installed:
$ php -m | grep xdebug
xdebug
Note: don’t forget to restart your webserver after installing Xdebug
All set? Now to the real configuration part.
First we need to indicate to your PHP that we want to be able to debug its execution:
# php.ini (or any other .ini loaded configuration file)
# Bare minimum to enable debug on a PHP running locally
xdebug.remote_enable=1
xdebug.remote_port=9000 # Or any other port that suits you

# If PHP runs in a distant server (like in a Vagrant VM)
xdebug.remote_host = your.dev.machine.ip
# OR
xdebug.remote_connect_back = 1
xdebug.remote_host is more secure, as debugging will only be possible from
the specified IP, pretty much like a whilelist. However, as I usually develop using a VM
and a private network between my host a my VM, I usually go with xdebug.remote_connect_back,
which means that Xdebug will provide debugging API to whoever runs an HTTP query.
Please refer to Xdebug’s remote configuration for finer tuning.
Configure you IDE
It depends on the IDE, please refer to their documentation. Here’s the PHPStorm one
This is really important, as your IDE is reponsible to listening to Xdebug.
Note: In PHPStorm, don’t forget to click on Run > Start Listen PHP Debug Connections
Also, don’t forget to actually place a breakpoint in your code.
Trigger debugging
Xdebug is monitoring PHP’s execution, looking for specific parameters to trigger connection to your IDE.
- When running PHP from CLI:
XDEBUG_CONFIG='idekey=your_ide_session_name' php script-that-will-be-debugged.php- When running PHP through an HTTP server
Xdebug looks for specific request GET/POST parameter, or specific cookie. You can
either add ?XDEBUG_SESSION_START=session_name to your url (GET parameter), or use
PHPStorm’s very useful bookmarklet
to create/delete the cookie triggers.
TL;DR
- Stop putting randon debug code in your beloved code
- Please use bleeding-edge technology from the 80’s
- Enjoy easy, fast, side-effect free* debugging
* Almost side-effet free, depend on what expression you evaluate. Obviously evaluating a file_put_contents() function will have side-effects on the filesystem…
